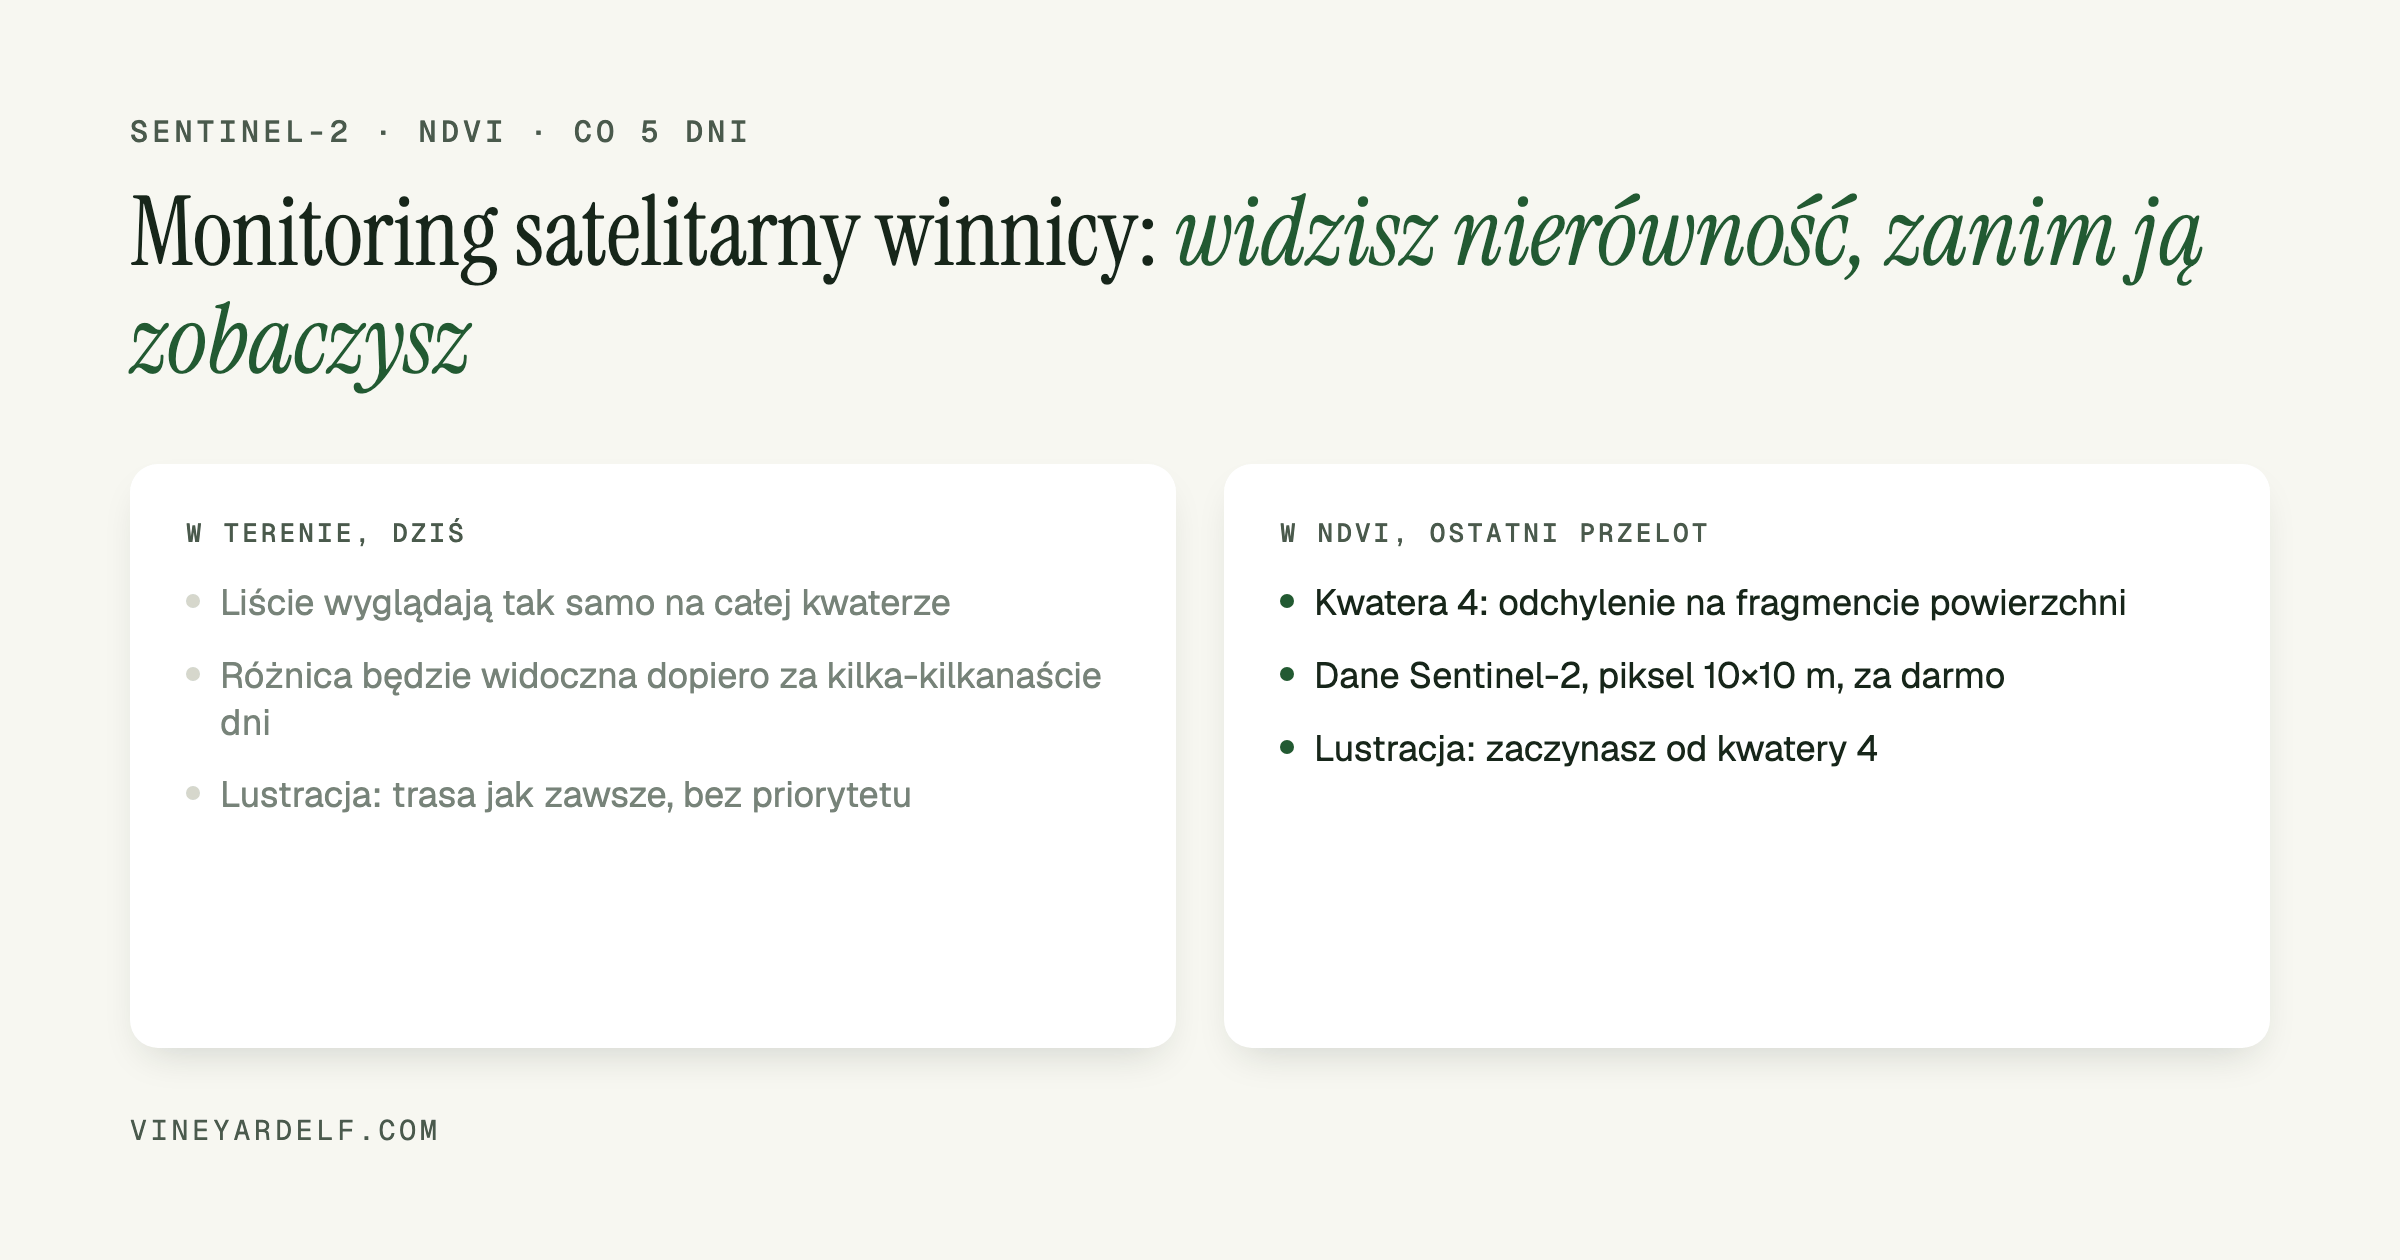
A satellite image of your vineyard from three days ago can show uneven growth on a block before you see it with your own eyes during a walk-through. It does not replace walking the rows, but it tells you which block to start with.
What NDVI is and where the data comes from
NDVI (Normalized Difference Vegetation Index) is calculated from the difference between red light and near-infrared light reflected by leaves - healthy, dense canopy reflects near-infrared differently than a stressed vine or bare soil between rows. The result is a map where blocks and parts of blocks are colored from weak growth to very vigorous.
The data behind this comes free of charge from the Sentinel-2 satellites of the EU Copernicus programme, operated by the European Space Agency. The satellite pair images the same plot roughly every 5 days, at 10 meter resolution in the bands needed for NDVI. Data is accessed through the Copernicus Data Space Ecosystem - registration is free, no drone or extra hardware needed.
What this actually gives a small vineyard
On a few hectares a grower walks the whole vineyard regularly anyway, so satellite data does not replace your own eyes. What it changes is the order in which it makes sense to walk:
- You see unevenness before it is visible to the naked eye - differences in vine vigor (water, nutrition, early disease) often show up in NDVI several days to over a week before they show on the leaves.
- You prioritize your walk-through - instead of a random or always-the-same route, you go first to where the map shows a block deviating from the rest.
- You get a point of comparison over time - comparing the same part of a block with the previous satellite pass shows whether a problem is getting worse or easing after treatment.
Limitations worth knowing
A 10x10 m pixel covers several vines at once, so on a small, fractional-hectare block the map shows a general trend, not a single sick vine. Clouds block the image entirely for that pass - in a cloudy season, more than 5 days can pass between two usable images. NDVI also does not tell you the cause of a dip - water, nitrogen, disease or pest still has to be worked out on site.
How to get started
Sentinel-2 data is free and open to anyone through the Copernicus Data Space Ecosystem - you can pick your own area and pass there directly, though you will need to crop the image to your own plot boundaries by hand.
In VineyardElf the same mechanism sits behind the Satellite (NDVI) screen: once you connect a free Copernicus account (Settings › Sensors) and draw your parcel boundaries once in Rows and parcels, the figures are calculated straight from that outline, with no manual cropping or looking up coordinates. Full instructions: Satellite data (NDVI) in VineyardElf help.